Anyone have a good open source software to manage multiple Linux servers?
I have a PI, small NUC, some USFF PC’S.
I need a console/dashboard to see if any are pending updates, software, resources, etc.
The best I’ve used has been Nagios, Zabbix or maybe you would be interested in something like rport or ipmonitor.
Would those let you console in? I was looking at Cockpit from Redhat as well. That seems to fit the bill.
rport does SSH, RDP, VNC but not sure about console. I use Remmina but not to view updates etc. Just to save logins for a large list of servers which allows one-click connect after entering master PW.
1 Like
Zabbix is the only one I have experience with. It seems to provide an all-around package that is easy to use. Mind you, I am not big into managing servers.
I get by with:
- Ansible to install a common setup on all machines
- Unattended-upgrades to install security updates
- byobu to run a friendly tmux so I can ssh in, do stuff, disconnect, and come back another time and it’s still all there
I’m planning to implement prometheus and grafana to monitor server state - I’ve done the installs but need to find meaningful dashboards, and then do alertmanager as well to get alerts.
2 Likes
Thank you for the reply Morgs ![]()
I do have unattended upgrades on my VPS as it’s exposed to the internet all the time.
I guess I should probably use it on my Raspberry pi on my Home server as well ![]()
I’ve heard of ansible but never used it. Does ansible have a ui?
I was looking more for a solution that has a web interface with a agent on the box, but couldn’t really find that solution.
The closest solution I found to a ui-based project was was the cockpit project from Red hat. It will allow you to set up cockpit on one server and within the UI you can add additional servers via SSH keys.
Cockpit actually works pretty nice, I would highly recommend it. ![]()
![]()
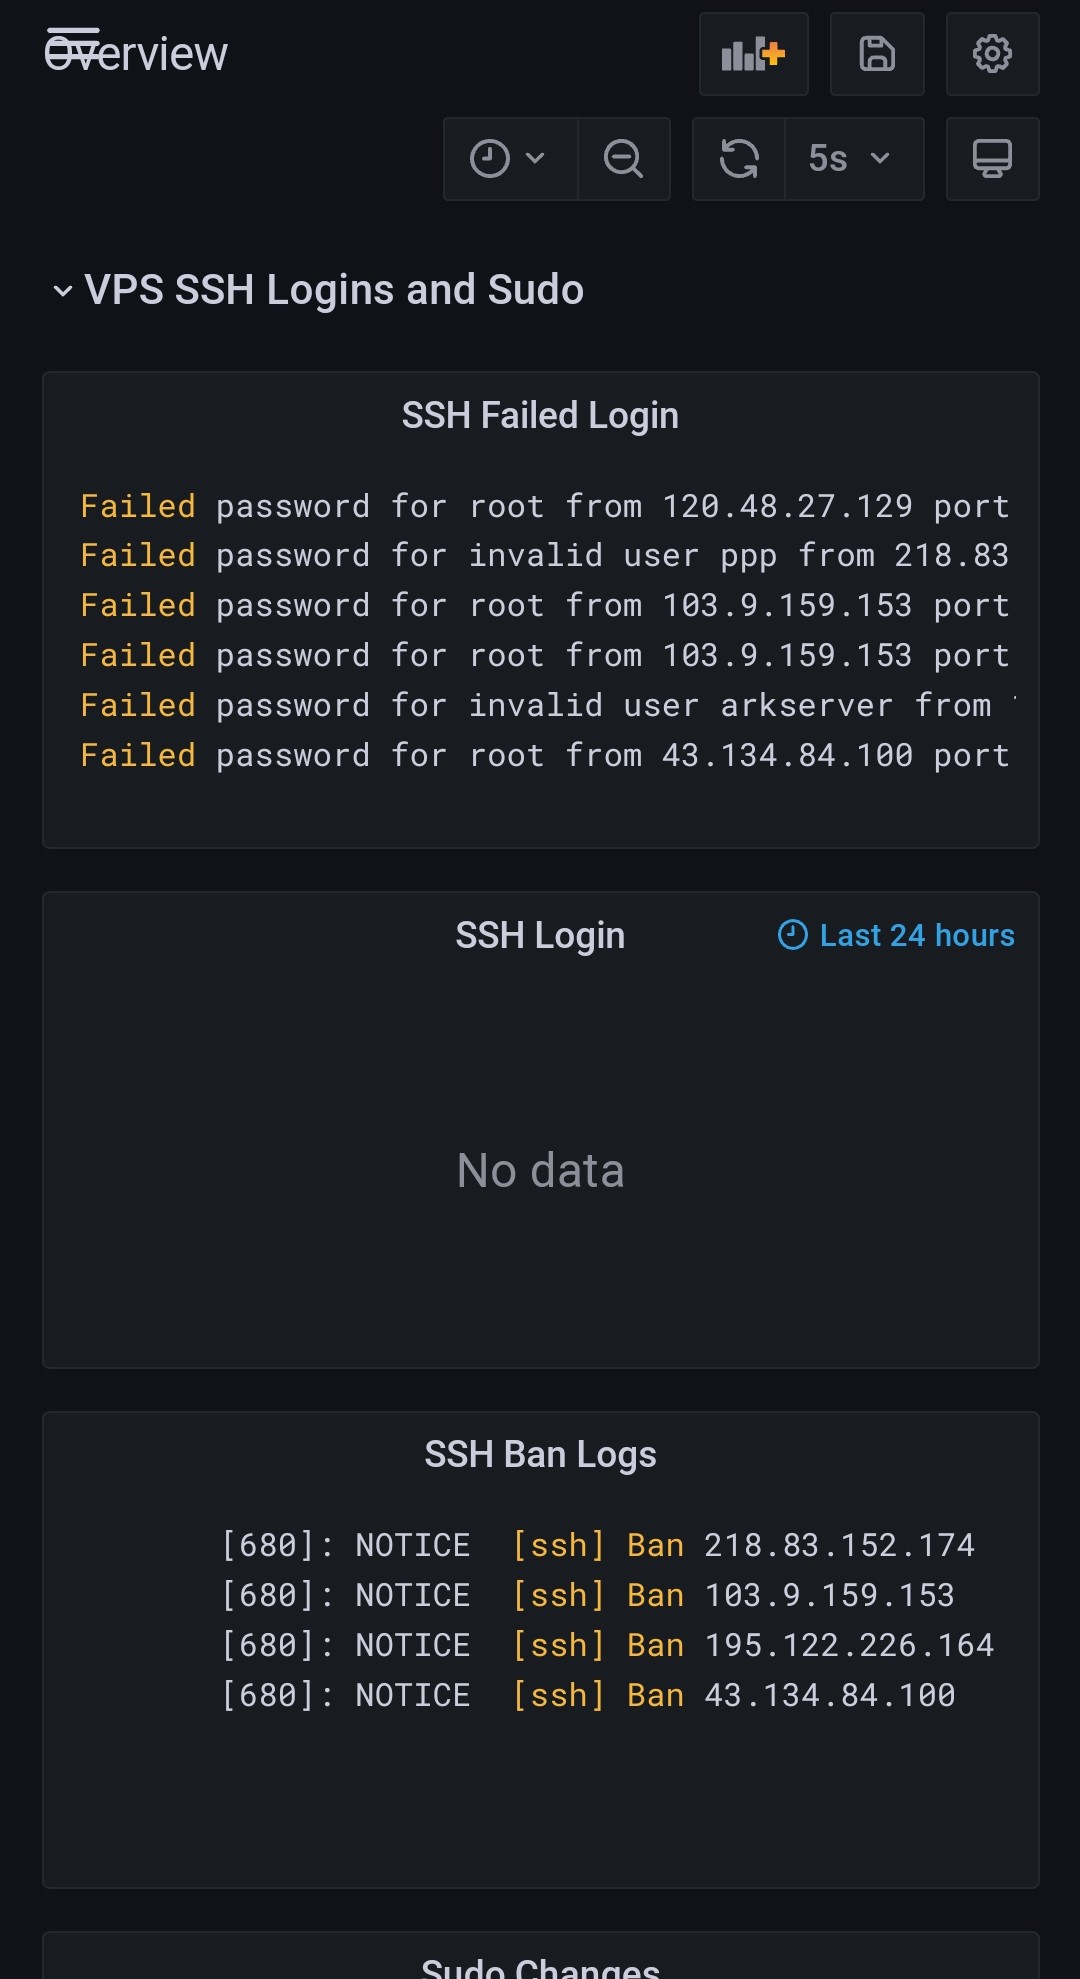
I love garfana and prometheus.
What I do is I go to the garfana website and I find dashboards. And then I ripped them apart I adjust them from my needs and I add more and more panels.
I haven’t used alert manager yet. Although I should set up alert manager because I’m monitoring my SSH logins by a loki and it’s very beautiful.
1 Like
This looks really clean. Nice!
Ansible is a python-based DevOps system to script installations. You define installations in yaml files, and it ssh’s into all your machines as defined in various groups, and does the actions specified - installing software, updating config files etc. It’s great for setting up new machines in a consistent way, and updating your whole “fleet” to the same setup.
For example, I use it to install a web stack on web servers, including nginx and certbot for LetsEncrypt, and running certbot to generate the certificate, etc. A few minutes and a new VM is fully set up.
It does take a lot of work to script everything, but in the end it’s worth it - I have a project coming up to redeploy a company’s whole hosting environment on a different cloud provider, and I finally have the whole stack scripted so it will be quick to do.
I do wish that there was a UI tool for server management - I tried Canonical’s Landscape some time back and it was great for installing updates, but didn’t cover everything I wanted - and beyond the free tier it’s $$$!
1 Like
You might want to take a look at Webmin. It is installed on each server and accessed via the web. It support virtually all flavors of Linux and allows management of multiple servers. www.webmin.com
1 Like
Welcome to the community! That’s a great suggestion. I will add it later to our wiki-post as well:
I used to use webmin back in the day but I removed it when the back door happened. I couldn’t trust it after that.
I switched over to cockpit from Redhat.
@morgs does what I do – Ansible to deploy a common config to systems, and then I use screen (never was able to switch to tmux, but whatever) because I know my connection will die at some point. I personally ssh to a central server (basically a jump box), and make my SSH connections from there, but per-server tmux/screen is fine too.
Also, I am moving to a IAC (infrastructure as code) setup, where 100% of the administration is done via Ansible – and, I’m starting to treat the servers as immutable, even though they aren’t immutable. That way, I always know that I can rebuild any server at any time… and I can always upgrade by deploying a new VM (part of my Ansible deployment code is to upgrade the distro to the latest patchlevel).
I mentioned elsewhere that I run a cluster of about 650 Linux servers at work; we use a similar setup there, using Salt today (moving to Ansible).
1 Like
I would recommend fleet. It is based on the Kubernetes platform. It is powered by AI to automatically scan accross your Linux infrastructure and fix common issues like crashing pods or resource induced challenges. It can manage across your Pi to your NUC with a unified interface.
Can you provide the link to that website? thanks
This is the link to the original open source platform
While this one below is a link of a fork of the original fleet project. This was developed by Rancher Labs. This has additional capabilities for managing larger clusters.
I have recently started to look at the Prometheus and it looks great. Really connect any grafana instance and configure the same.
alles gut,
Gaurav
I asked because fleet.ai isn’t related and may be confusing to readers. Thanks for adding correct link. I went ahead and removed the fleet.ai
Prometheus and Grafana would be a good one. It tracks and collects server metrics and presents them in a centralized view so you can easily detect and troubleshoot any potential issues. I would also mention Portainer. It makes for easy deployment of Docker Containers across the server fleet.